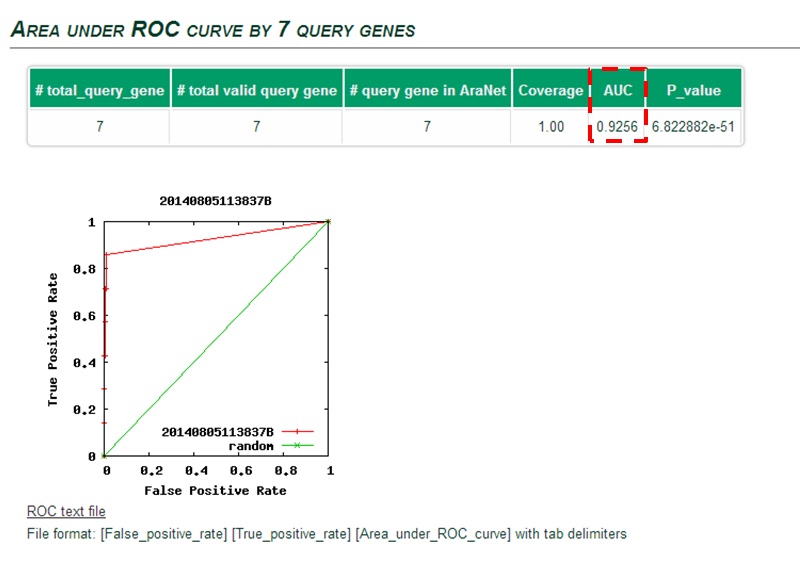
The ROC curve can be summarized in a single Area under ROC curve (AUC)
score which is a numerical measure of prediction power.
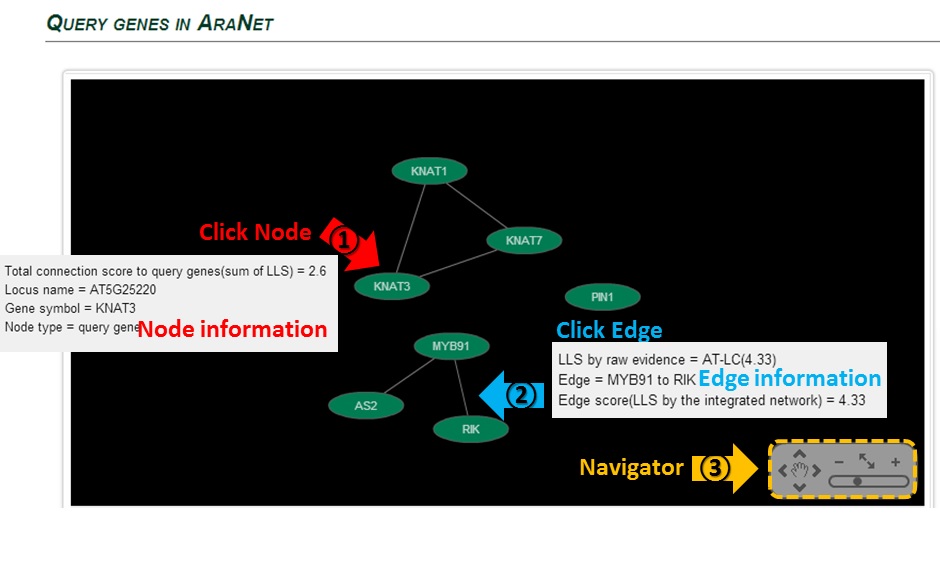
The connection of query genes will be visualized by Cytoscape.
This requires installation of adobe flash player.
Clicking on (1) node or (2) edge will present you the information.
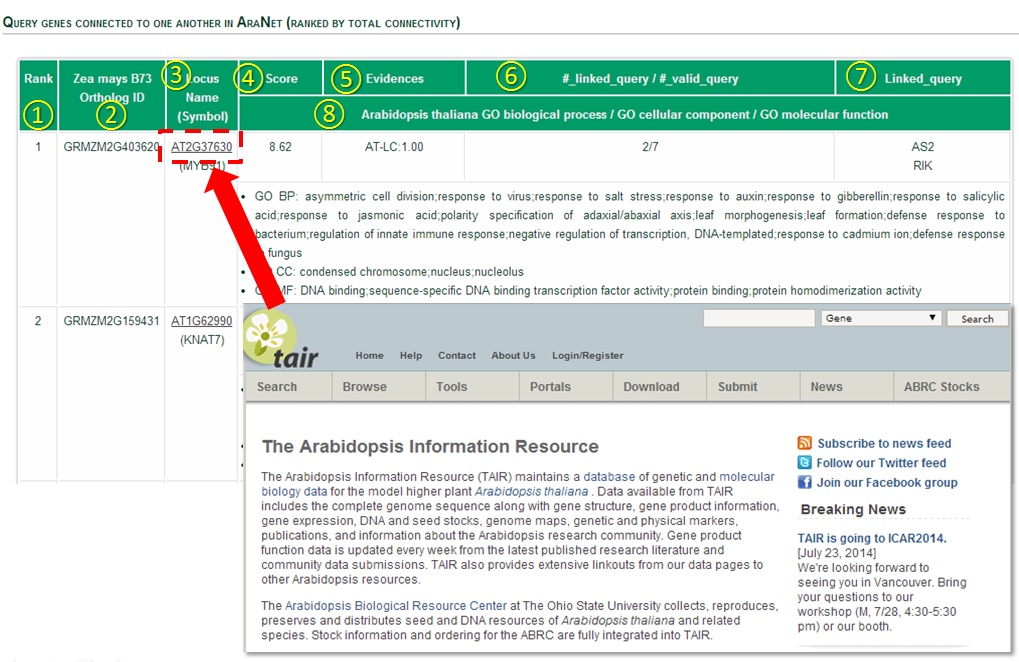
The query genes that are connected to each other are shown on a table by rank order.
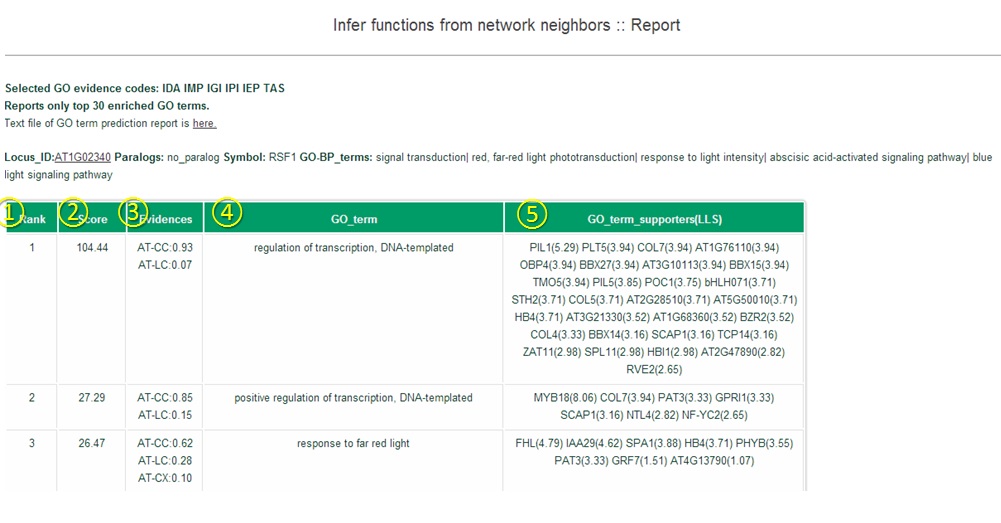
(1) Rank by total connectivity: Guilt-by-association principle prioritizes
query genes by their connectivity to other query genes.
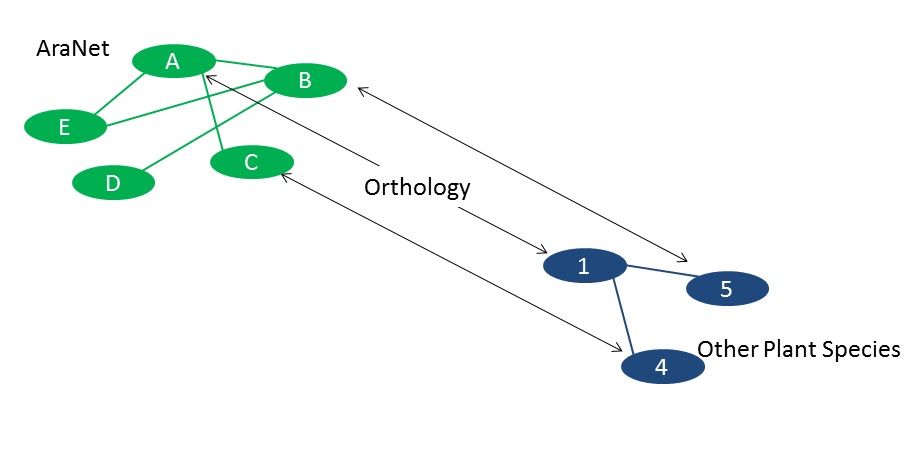
(2) Other plant species ortholog gene ID: This column shows gene ID of other plant species that are orthologous to
Arabidopsis genes. It won’t be shown if you query in Arabidopsis genes.
(3) Locus name: Gives the name of Arabidopsis query genes or Arabidopsis ortholog genes of other species genes.
Symbol represents alternative common names.
(4) Score: Sum of LLS (Log Likelihood Scores) of network links to all other query genes.
(5) Evidences : list of subnetworks (see network download page) supporting network-based prediction and their
fraction of contribution
(6) #linked query/ # valid query : The number of linked query genes over the number of total valid query genes.
(7) Linked query : Shows a list of linked query genes.
(8) Arabidopsis thaliana GO terms : Shows GO biological process, cellular component, molecular function of query
Arabidopsisgenes or Arabidopsis genes
that are orthologous to other plant query genes. (when submitted other plant species gene queries)
Clicking Arabidopsis gene name leads to TAIR website for detailed description of the gene.
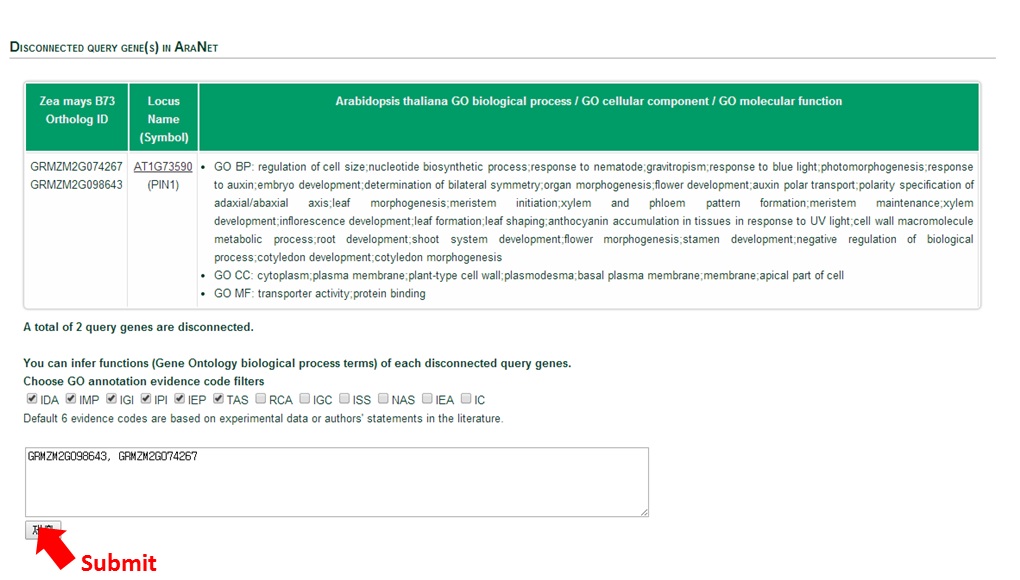
Genes that are not connected to any other query genes are also shown (disconnected genes).
You can infer function from their neighbors (which would not be query genes) by clicking the submit button below.
(For inferring function, see ‘Infer function from neighbors’ tutorial)
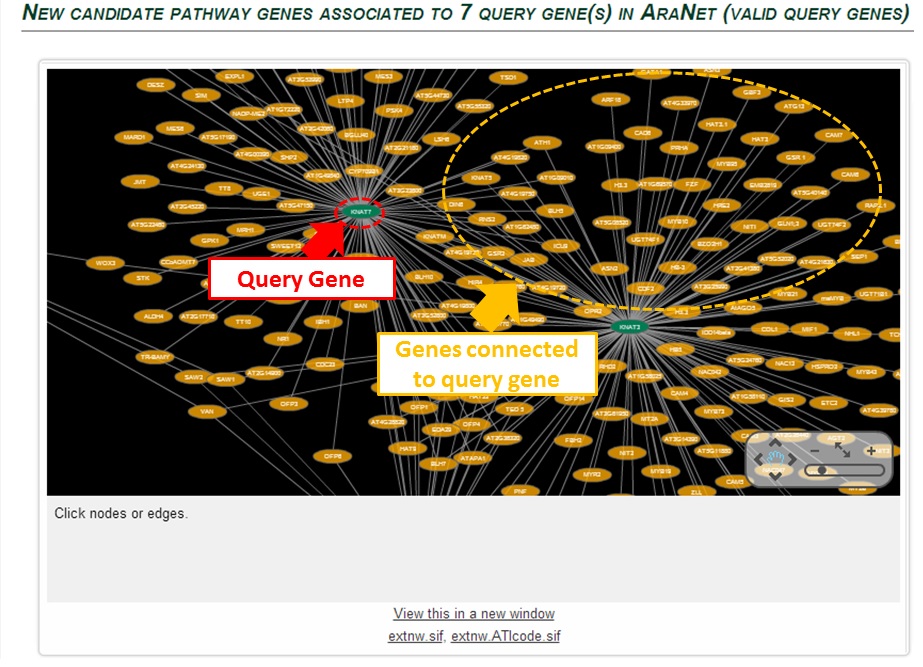
Candidate genes (orange ovals) that are connected (grey lines) to query genes (green ovals)
are visualized in cytoscape. As in tutorial part B, you can get information of edges or nodes by clicking them
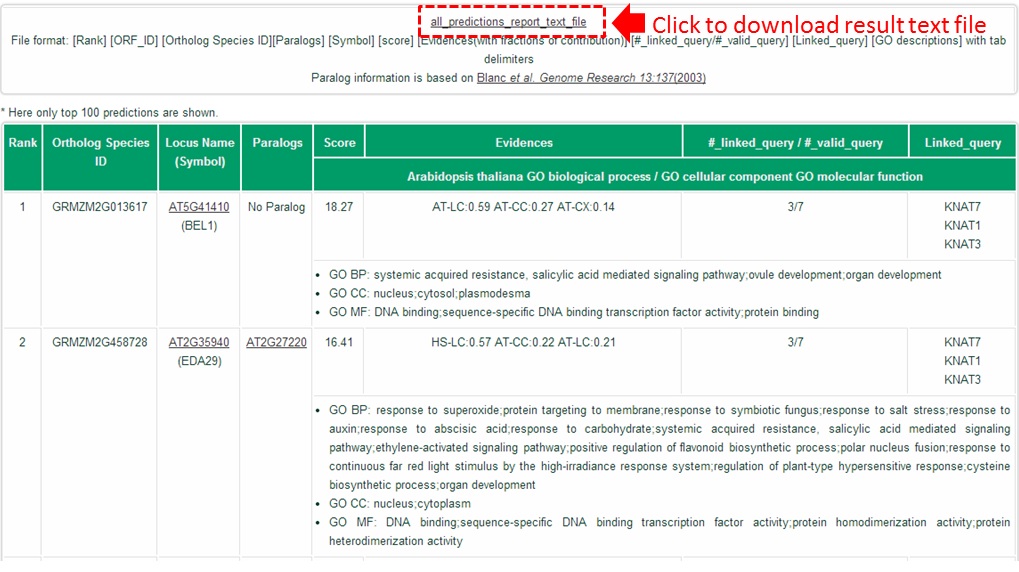
AraNet v2 provides list of candidate genes that are ranked by connectivity of genes to the query gene.
Maximum 100 predictions are shown on the web but you can download the full result list by clicking all_predictions_report_text_file.
The columns are the same as described in tutorial part C.