|
| ||||
| Home | Tutorial | Gene prioritization | Network-download | |
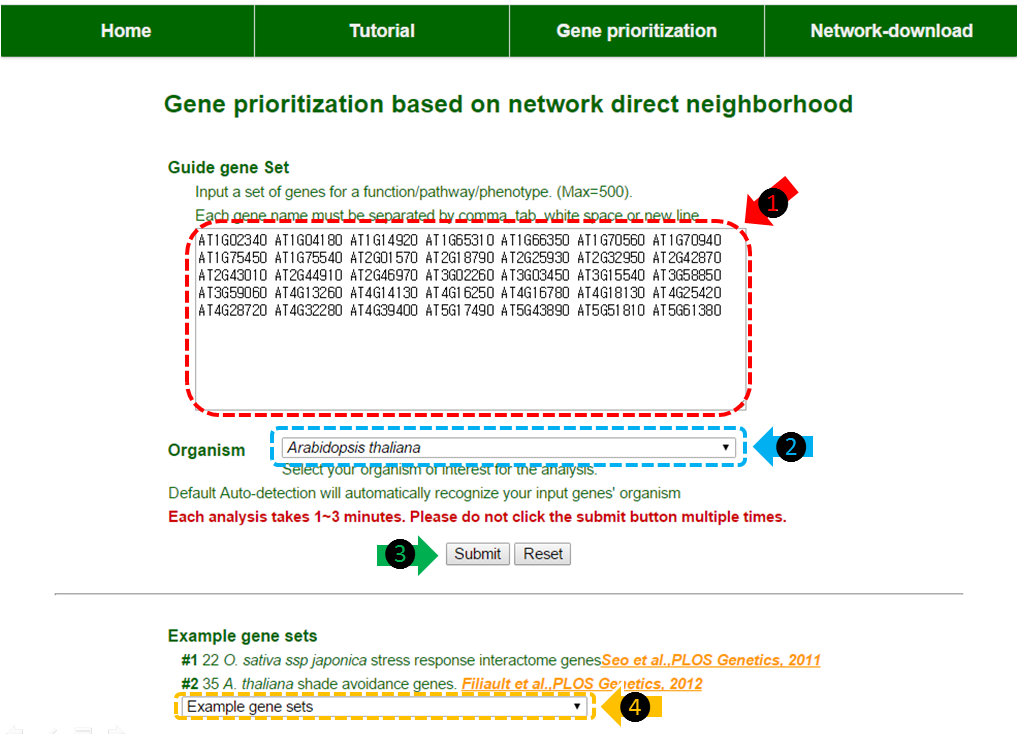
(1) Insert your guide genes in the text box. The gene names must be separated by tab, comma, white space or new line. A maximum of 500 genes are available. It is important to match the gene name form to the example gene names provided.
(2) Organism selection box. By selecting among Oryza sativa spp. japonica, Oryza sativa spp. indica and Arabidopsis thaliana, the web-server will recognize your species of interest. The default setting is auto-detection. The auto-detection will automatically recognize your input gene if the genes are submitted in correct form.
(3) Click ‘submit’ button to start the analysis. This may take about 1~3 minutes.
(4) You could select our example guide genes for a test run. In this tutorial, A. thaliana shade avoidance genes were selected.
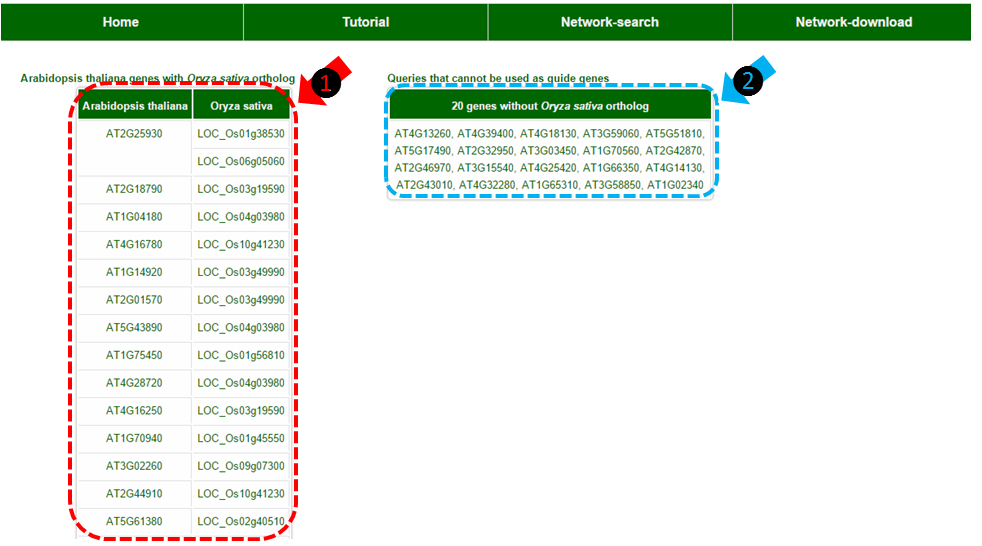
(1) Table of genes with Oryza sativa orthologs in RiceNet. This table does not show when you run your analysis with Oryza sativa spp. japonica genes. The rest of the results would be based on these genes.
(2) Table of genes without orthologs or genes that are not in current annotation version which cannot be used for analysis. This table does not show when you run your analysis with Oryza sativa spp. japonica genes
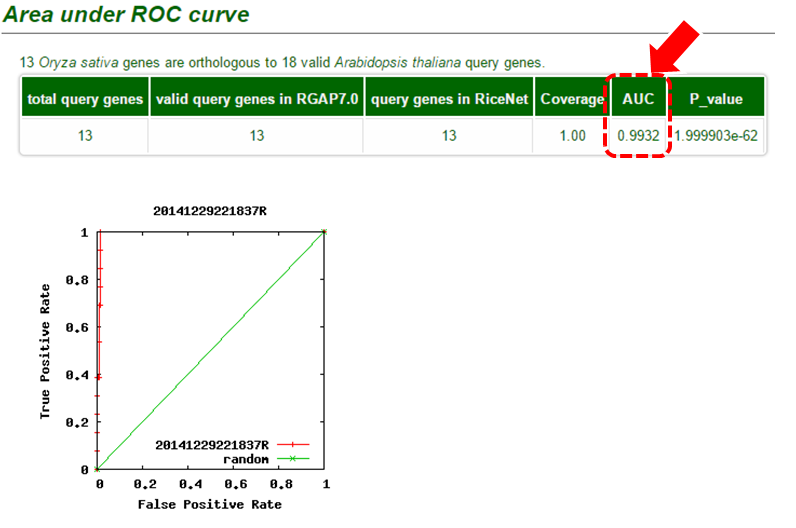
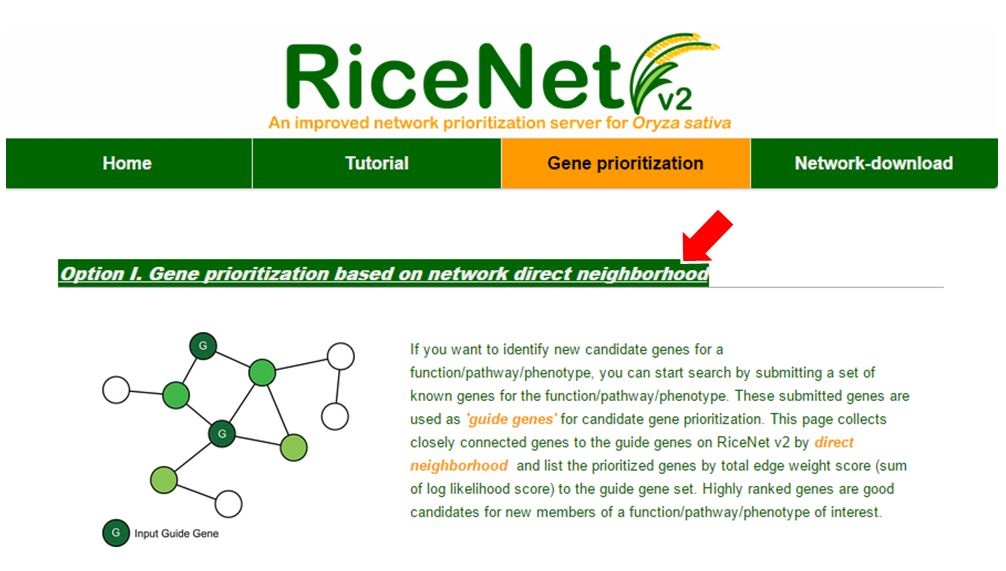
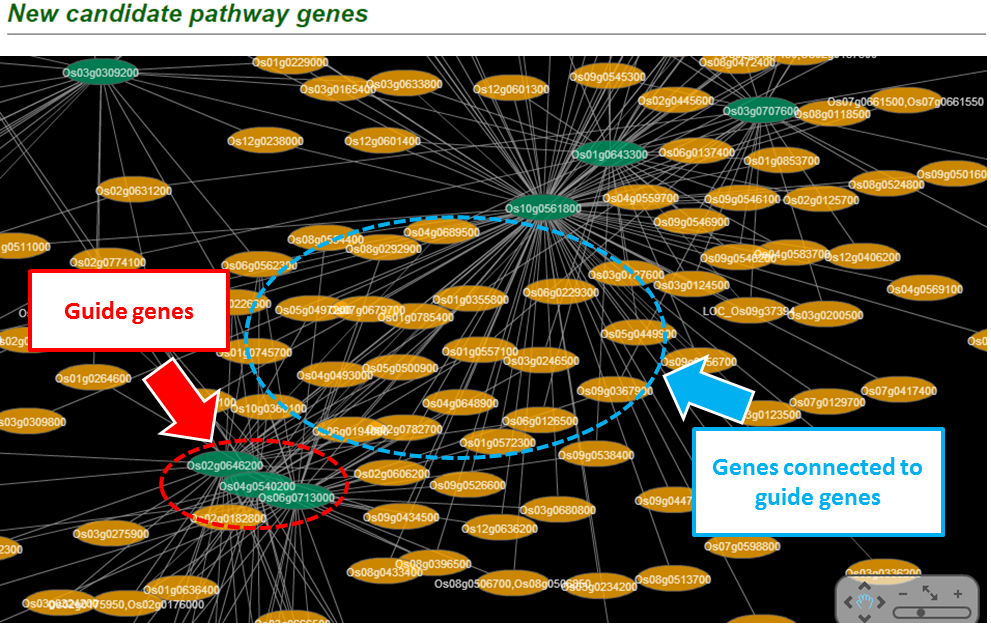
If the guide genes are well connected to one another by the network, other genes that are connected to the queries have a high probability of being a new candidate gene. This assumption makes us possible to estimate the prediction power of the network by measuring inter-connectivity of the genes. Candidate genes are ranked by how well they are connected to the guide genes. (calculated connectivity scores) Query genes that are well connected to one another will be highly ranked. Prediction power by this rank order can be assessed by Receiver Operating Characteristc (ROC) curve which represents the true positive rate (TPR) for the given cost of false positive rate (FPR) as described here.


The ROC curve can be summarized in a single Area under ROC curve (AUC) score which is a numerical measure of prediction power.
- AUC = 0.5 : random prediction
- AUC = 1.0 : perfect prediction
- AUC > 0.7 : Indicates significantly high prediction
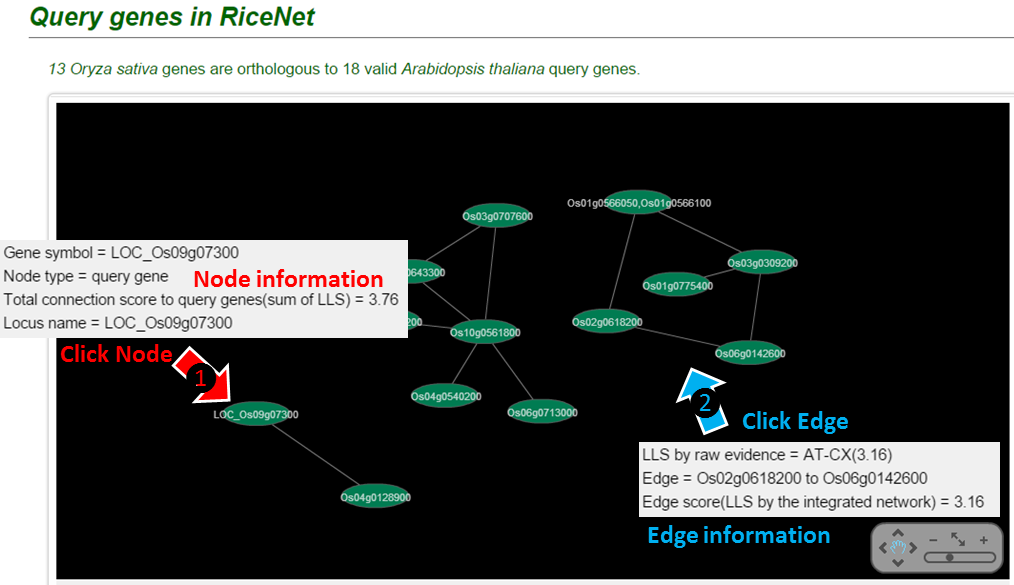
The connection of guide genes will be visualized by Cytoscape. This requires installation of adobe flash player.
Clicking on (1) node or (2) edge will present you the information.
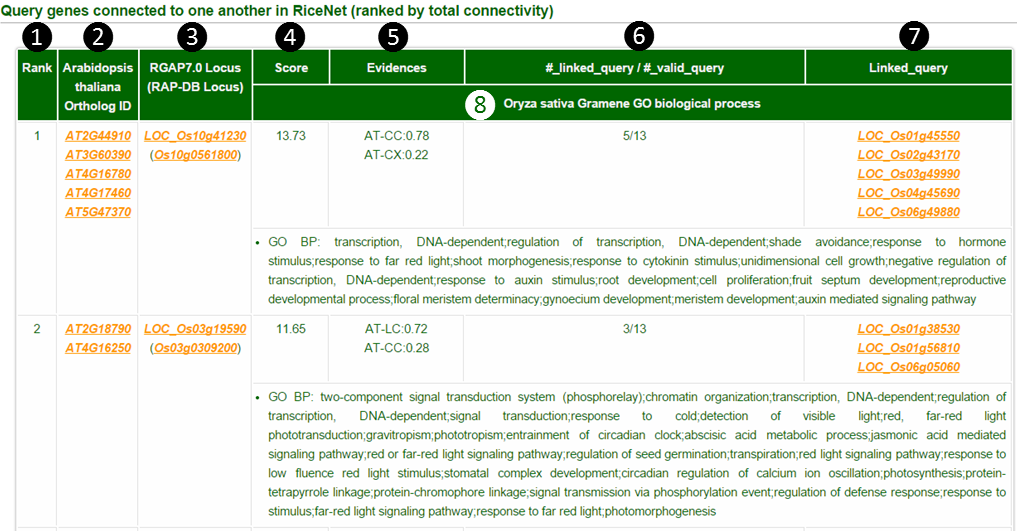
The guide genes that are connected to each other are shown on a table by rank order.
(1) Rank by total connectivity: Guilt-by-association principle prioritizes guide genes by their connectivity to other guide genes.
(2) Ortholog gene ID: This column is shown when gene IDs of Oryza sativa spp. indica or Arabidopsis thaliana are submitted as guide genes. Genes orthologous to Oryza sativa spp. japonica are presented.
(3) Locus name: Gives two types of locus names. Oryza sativa spp. japonica RGAP locus and RAP-DB locus.
(4) Score: Sum of LLS (Log Likelihood Scores) of network links to all other guide genes.
(5) Evidences : shows the fraction of links from component networks (see network download page) supporting network-based prediction. In this example, AT-CC:0.78 means that the portion of 0.78 of LLS score(which would be about 10.71) comes from AT-CC component network.
(6) #linked query/ # valid query : The number of linked query guide genes over the number of total valid query guide genes.
(7) Linked query : Shows a list of linked query guide genes.
(8) Oryza sativa spp. japonica GO terms : Shows Gramene annotated GO biological process terms of guide japonicagenes. If you submit indica or Arabidopsis genes as guide genes, the GO terms would be the terms for orthologous japonica genes.
Clicking the locus names lead to corresponding annotation databases for detailed descriptions.
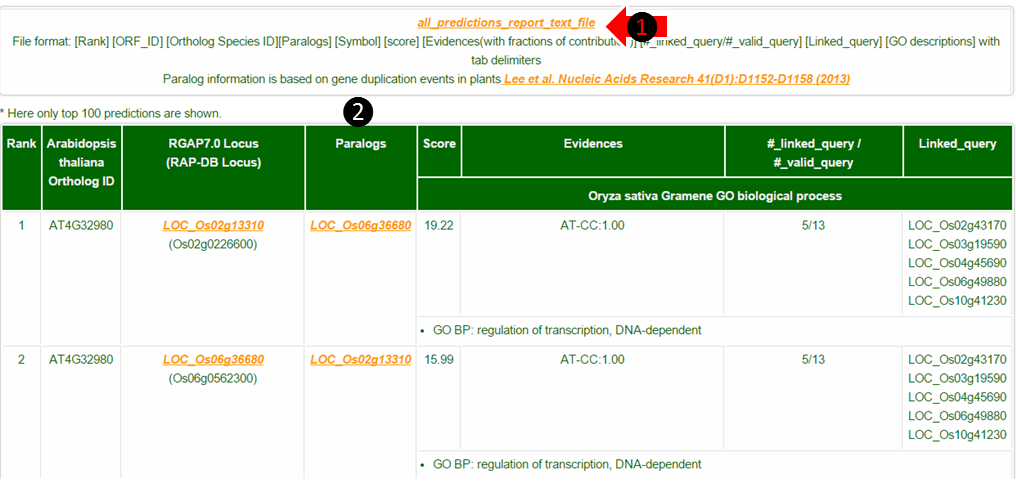
(1) Maximum 100 predictions are shown on the web but you can download the full result list by clicking all_predictions_report_text_file.
(2) Paralogs are given by gene duplication events. The existence of paralogs may decrease the chance of observing successful candidate gene knock-out phenotypes. The rest of the columns are the same as described in tutorial part C.
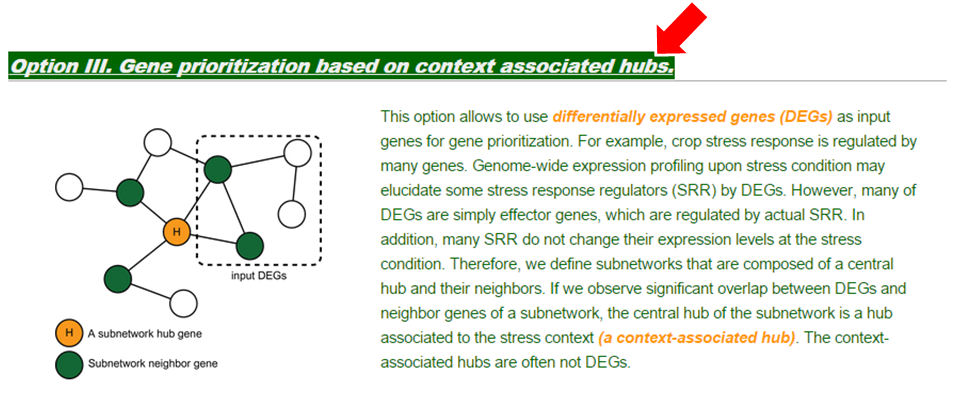
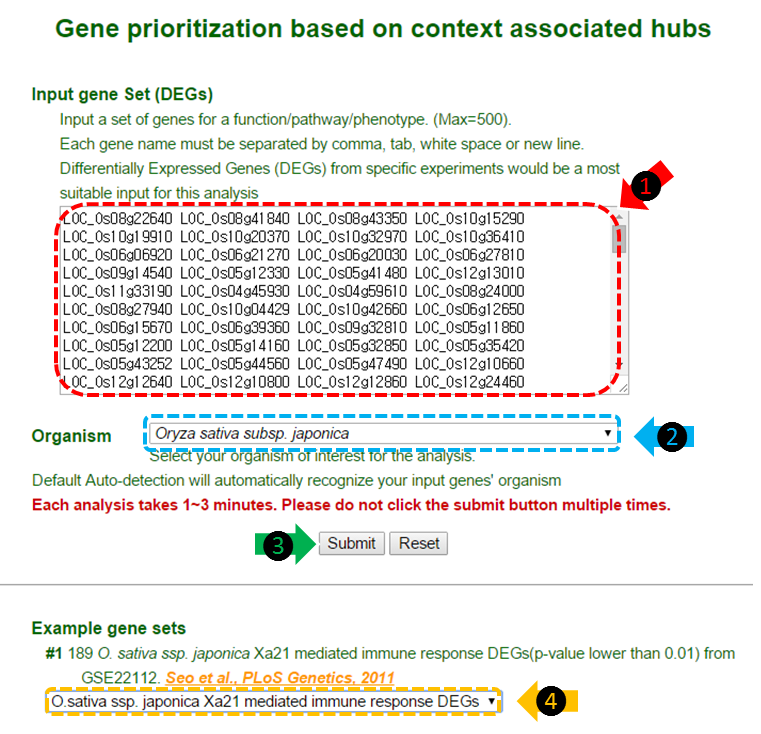
(1) Insert your DEGs in the text box. The gene names must be separated by tab, comma, white space or new line. A maximum of 500 genes are available. It is important to match the gene name form to the example gene names provided.
(2) Organism selection box. By selecting between Oryza sativa spp. japonica or Oryza sativa spp. indica, the web-server will recognize your species of interest. The default setting is auto-detection. The auto-detection will automatically recognize your input gene if the genes are submitted in correct form.
(3) Click ‘submit’ button to start the analysis. This may take about 1~3 minutes.
(4) You could select our example guide genes for a test run. In this tutorial, O. sativa japonica Xa21 mediated immune response DEGs were selected.
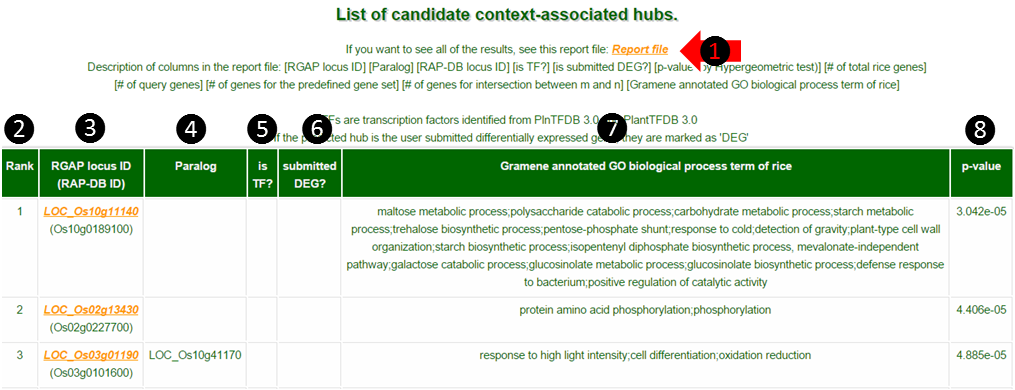
(1) Maximum 100 predictions are shown on the web but you can download the full result list by clicking Report file.
(2) Rank : Hubs are ranked by their significance of p-values.
(3) Locus ID: Gives two types of locus ID. Oryza sativa spp. japonica RGAP locus and RAP-DB locus.
(4) Paralogs are given by gene duplication events. The existence of paralogs may decrease the chance of observing successful candidate gene knock-out phenotypes.
(5) is TF: If the hub is a transcription factor, it is marked as TF.
(6) is DEG : If the hub is one of the DEGs submitted by the user, it is marked as DEG.
(7) Oryza sativa spp. japonica GO terms : Shows Gramene annotated GO biological process terms of japonica context-associated hubs. If you submit indica or Arabidopsis genes as DEGs, the GO terms would be the terms for orthologous japonica hubs.
(8) p-value : Hypergeometric p-value of the hub.
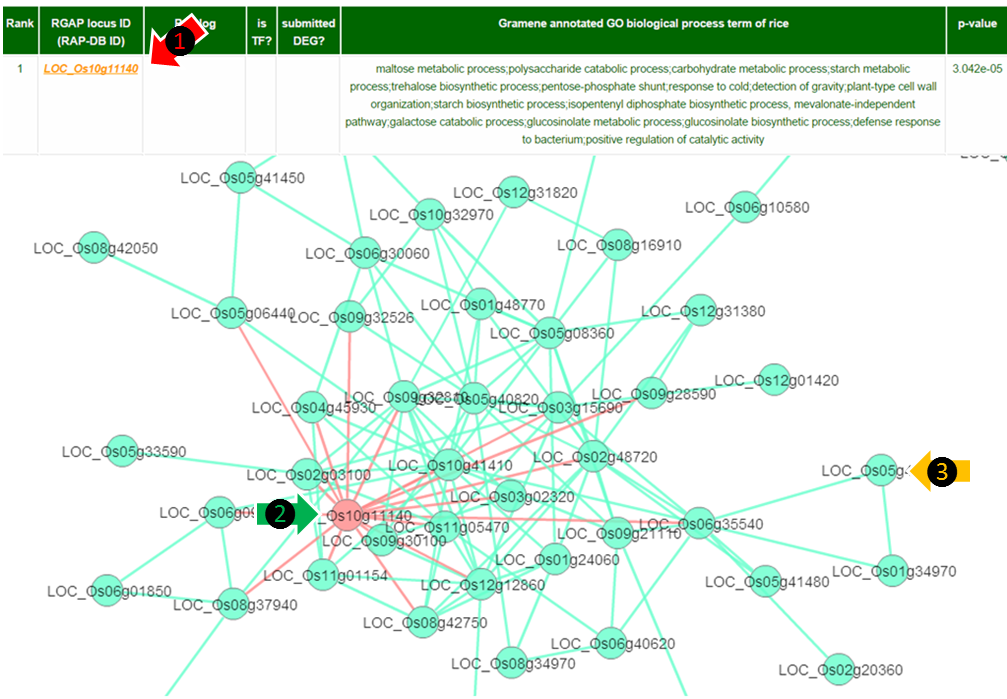
(1) By clicking the locus ID the web server provides network visualization of the connections between candidate hub genes and their DEG parteners as below.
(2) Red node : Hubs are denoted in red. The edges to query DEGs are denoted as red lines.
(3) Cyan node : Query DEGs are denoted in cyan. Connections of query DEGs are denoted as cyan lines .
You can get the information of the nodes or the links by clicking on them.